
70
pontificia universidad católica de puerto rico
1990
1970
1975
1980
1985
1995
2000
2005
2010
2015
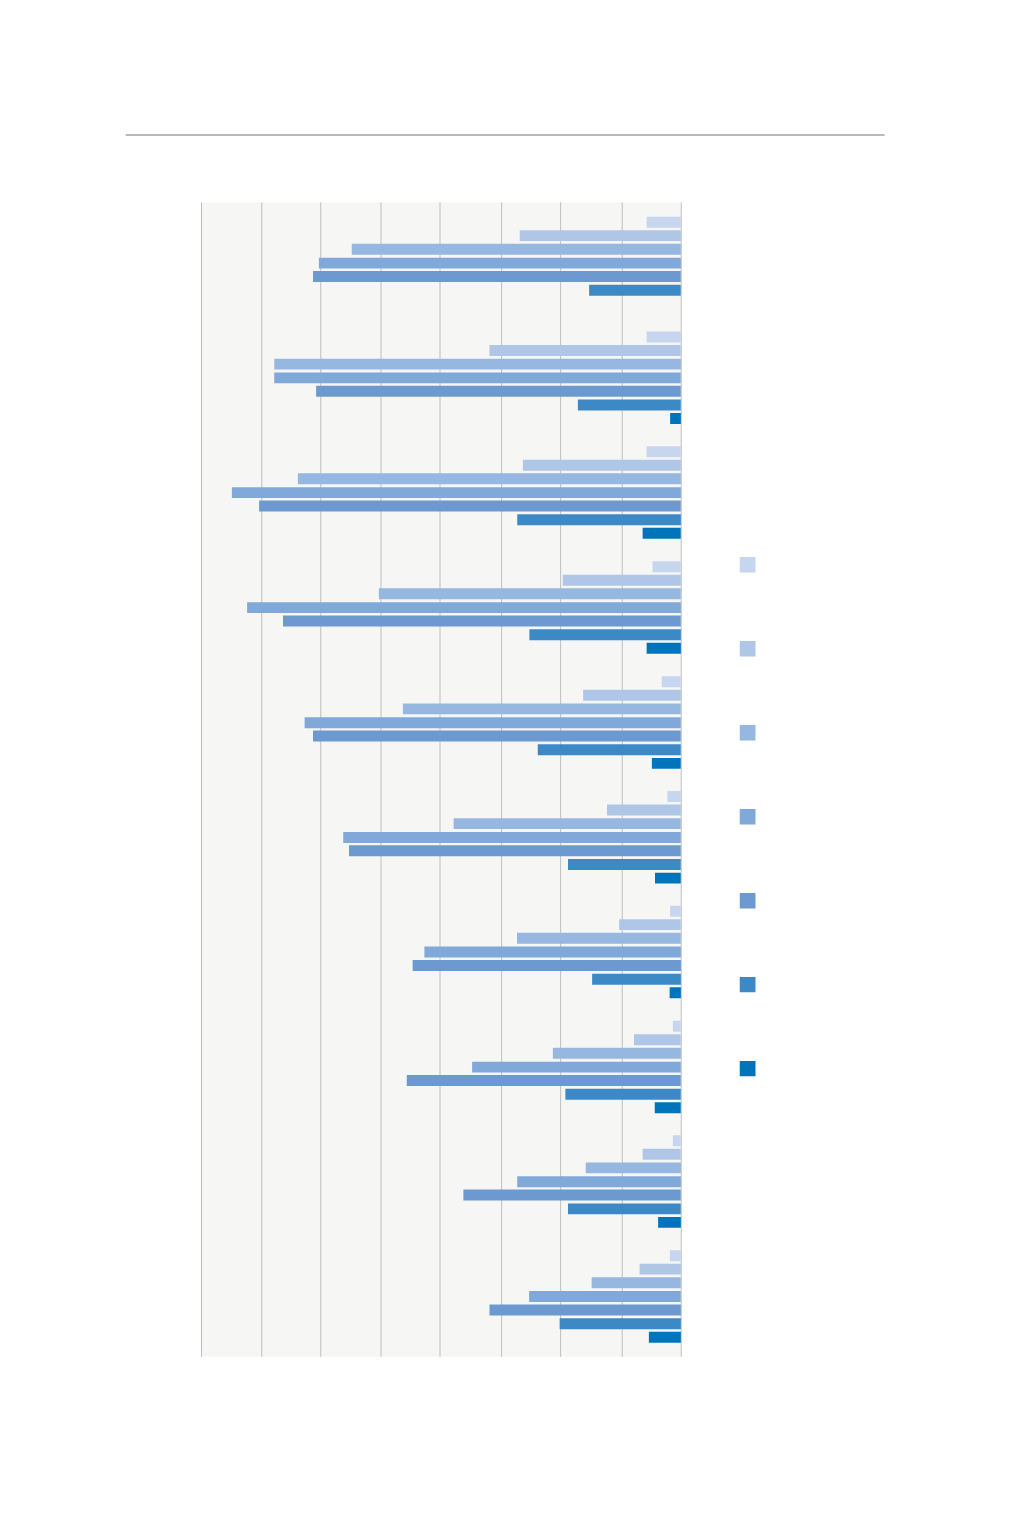
16-19 20-24 25-34 35-44 45-54 55-64 65 o más
11
41
64
51
30
14
4
8
38
73
55
32
13
3
9
39
92
70
43
16
3
4
30
90
86
55
21
4
9
38
111
113
76
25
5
10
48
123
126
93
33
7
12
51
133
145
101
40
10
13
55
141
150
128
53
12
4
35
122
136
136
64
12
0
31
123
121
110
54
12
Gráfica 17
Empleo por grupo de edad mujeres - serie histórica
Fuente:
Departamento del Trabajo y Recursos Humanos de Puerto Rico (2010, 2015)


